Article
Survey Report: Are you really working harder now?
Primary care doctors think they're putting in longer hours and seeing more patients than before. But that's not what our data show.
SURVEY REPORT
Are you really working harder now?
Primary care doctors think they're putting in longer hours and seeing more patients than before. But that's not what our data show.
By Berkeley Rice
Senior Editor
It may seem as if you're working harder than ever. But most primary care doctors are putting in the same number of hours now as they did three years ago. In fact, many are working shorter weeks than in 1998.
Those are the findings from the latest Medical Economics Continuing Survey, which samples MDs and DOs in office-based private practice. The typical primary care doctor now works 55 hours and sees 110 patients per week. Ob/gyns log the most time, with a median of 60 hours a week, followed by internists at 58 and FPs at 55. GPs and pediatricians work the shortest week, with both reporting a median of 50 hours.
In contrast, cardiologists put in the longest hours of all, with a weekly median of 64. Although cardiologists aren't included in our combined data for all primary care physicians, we've listed them separately for comparison in our tables.
Even though the typical workweek hasn't lengthened since '98, it sure seems longer to a lot of practitioners. When we asked respondents for their perception of whether their work hours had changed over the past three years, many primary care physicians reported an increase. For example, about half the internists and more than 40 percent of FPs, ob/gyns, and pediatricians said they're putting in longer hours. Only among GPs did more report a decrease than an increase in hours.
However, when we compared the hours worked this year with the results from our 1998 survey, the actual differences turned out to be minimal for most specialties. The cardiologists reported a slight increase in hours per week over that three-year period, and the internists had a slight decrease.
The survey results make it clear that even those doctors who are spending more time in the office aren't doing so by choice. When asked why their workweek has increased, the majority of our respondentsparticularly FPs, GPs, and internistscite "paperwork demands." Others say they're putting in longer hours to boost their income or to maintain it at a satisfactory level as reimbursements decline.
In general, hard work seems to pay off. Physicians who work 60 hours or longer and see at least 130 patients per week had gross practice incomes of $400,000 or more last year. But those who log only 50 hours and see fewer than 100 patients a week took in less than $140,000 in gross income.
Doctors in nearly all primary care fields report spending a median of 80 percent of their time with patients. A majority in each field say that figure hasn't changed over the past three years.
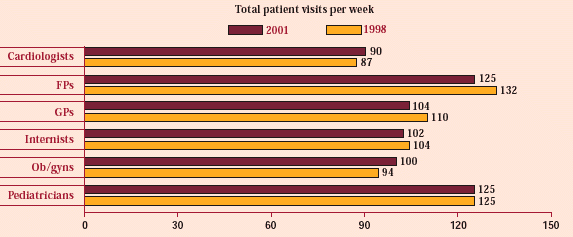
According to our data, FPs and pediatricians see significantly more patientsa median of 125 a weekthan other primary care physicians. For ob/gyns, internists, and GPs, the medians range from 100 to 104 patients per week, while cardiologists report a median of only 90 per week.
Although many doctors say their rate of patient visits hasn't changed much over the past three years, our survey data do show some changes since 1998. Total patient visits per week increased for cardiologists and ob/gyns, but decreased for FPs, GPs, and internists. Asked why their rate of patient visits had changed, doctors cited "pressure from managed care" and their desire to maintain or increase practice income.
Predictably, the rate of patient visits varies with doctors' age and years in practice. Differences by gender are particularly striking. Male doctors report seeing nearly 20 percent more patients per week than female colleagues do. That may be explained by the fact that male physicians put in a median of 58 hours per week vs 50 hours for female doctors.
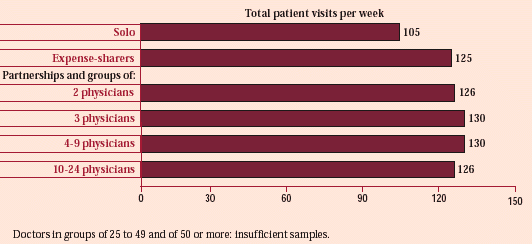
While soloists typically see the fewest patients, doctors in small groupsthree to nine physiciansreport more patient visits per week than their colleagues in groups of 10 to 24 doctors. And physicians who participate in HMOs and PPOs report significantly higher rates of patient visits than those who don't.
The accompanying charts and tables will help you weigh your work habits against colleagues'. An explanation of survey methodology appears in "Survey Report Earnings: Time to call a code?," Sept. 17, 2001.
Hard work can pay, big time
Length of workweek by specialty
How the workweek has changed since 1998

Patient visits by specialty
How patient visit rates vary by size and type of practice

How patient visits have changed since 1998

% of
A Medical Economics Web Exclusive
How patient visit rates vary
By years in practice ...
By physician's age ...
By gender ...
By managed care participation ...
By type of community ...
And by geographic region
Berkeley Rice. Survey Report: Are you really working harder now?. Medical Economics 2001;22.


