

Article
Pick stocks like a pro
Author(s):
Your Money

By studying a few key financial figures, you can get a solid idea of a company's prospects and reduce the chances that you'll make big mistakes. Stocks that shine according to the following measures are well-worth considering.
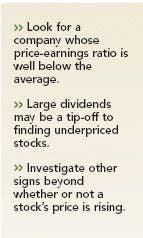
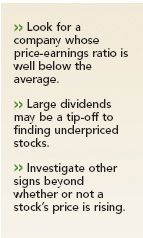
Price-earnings ratio: The P-E ratio of the stocks in the Standard & Poor's 500 Stock Index averages about 18. Bargain hunters should focus on companies with P-Es at least 20 percent below that (around 13 or 14) or those with reasonable P-Es whose growth rate exceeds market averages.
Price-book: You calculate book value by subtracting a company's liabilities from its assets. That gives you a rough idea of how much a company would net if it were to sell everything it owned. The typical stock in the S&P 500 trades for an average of about 4.3 times its book value. I'm on the lookout for stocks that sell for much less than that average and seem likely to improve earnings in the future.
Price-sales: Accountants can play games with earnings reports, but it's hard to alter sales figures. To calculate a company's ratio, divide the share price by sales per share. The lower the figure, the less investors are willing to pay for each dollar of sales, and the better the chance that the stock's price is a bargain. With the S&P 500 posting an average price-sales ratio of about 2.8, I'd pay attention to stocks with figures of less than 2.0.
Screen out those with other factors that could prevent them from ever recovering, such as bankruptcy, loss of key patents, or other problems that analysts cite as possibly being terminal.
Dividend yield: Thanks to the arithmetic of the stock market, hefty dividends often serve as signposts for underpriced stocks. The lower a stock's price falls, the higher the rise in its dividend yield-annual dividend divided by share price. I search for stocks that have dividend yields of at least 4 percent. But lately, the pickings have been slim, and I've been forced to settle for 3 percent. With stock prices reasonably high, the S&P 500's average dividend yield has dropped to about 1.8 percent.
Relative strength: This indicates whether a stock has been rising or falling lately and to what degree relative to an appropriate market benchmark. Some analysts swear by the measure, buying only stocks that have been climbing faster than the overall market for the last six or 12 months.
Taken by itself, however, relative strength can be a trap. Too often, last year's winner crash-lands. But I combine relative strength with other measures suggesting a stock is underpriced. That way, I find cheap stocks that the market's just discovering-and you can too.