Article
Physicians' Earnings: Our exclusive survey
As demand for primary care doctors plateaus, so does income.
COVER STORY
Physicians' Earnings
Our Exclusive Survey
As demand for primary care doctors plateaus, so does income.
By Wayne J. Guglielmo
Senior Editor
Markets typically reward scarcity, so it shouldn't be surprising that some of the nation's most sought after specialists are significantly ahead in the earnings race. Among the selected specialties we looked at for 2002, median total compensation was highest for invasive cardiologists$360,000.
The numbers come from the latest Medical Economics Continuing Survey, which sampled MDs and DOs in office-based private practice. Invasive cardiologists were followed, in order, by gastroenterologists, orthopedic surgeons, noninvasive cardiologists, and general surgeons.
The picture was different in primary care, where there's a "rough equivalency between supply and demand," according to Merritt, Hawkins & Associates, a physician search and consulting firm in Irving, TX. It reports that "income offers made to primary care physicians remained relatively flat," although generalists were still in demand in certain places, especially rural areas.
Among the primary care specialists we surveyed, ob/gyns led their colleagues with the highest practice revenue and also the highest total compensation ($500,000 and $220,000, respectively). Internists are on par with FPs with total compensation of $150,000. Pediatricians and GPs trailed behind with total compensation of $130,000 and $116,000, respectively.
A change in statistical methodology prevents a comparison with previous years. Nevertheless, several trends emerged.
For instance, it's good to go group; and if you do, look for a big, single-specialty group: Surveyed physicians in groups of 10 to 24 had the highest practice revenue ($700,000) and total compensation ($300,000). We also found that physicians in single-specialty groups received 16 percent (or $30,000) more in total compensation than their colleagues in multispecialty groups.
As might be expected, physicianswhether in primary care or specialty practicehit their earnings peak between the ages of 50 and 54. Earnings start to dwindle as retirement closes in, probably because they tend to taper their practices.
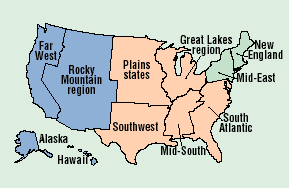
Physicians in the South had the highest total compensation, typically earning $30,000 more than their colleagues in the East, where total compensation was lowest last year.
And the gender gap persists. The typical female physician received $55,000 less in total compensation than her male counterpart. One of the reasons typically posited for that fact is that women are more likely to choose the lower paying specialties; they also tend to work fewer hours than their male colleagues. Among FPs, internists, and pediatricians, the gap is narrowest in family medicine, where male physicians earned only $10,000 more than female doctors.
Where do you fit in? The accompanying charts and tables will help you do a comparative analysis by specialty, age, geographic region, gender, and other variables.
How much did you earn last year?1
How earnings varied in 2002
A big gender gap
Where do you stand in the earnings race?
Physicians in the South earn the most

A closer look at total compensation
in primary care
How this year's survey was conducted
Questionnaires for this year's Medical Economics Continuing Survey, developed and fielded under the direction of Sandy Johnson, manager of field services, were mailed in mid-March to 24,335 MDs and DOs in private, office-based practice throughout the US. This represents a random sampling of nine selected specialties from the AMA master list maintained by Access Worldwide-the Phoenix Marketing Group. A follow-up mailing to nonrespondents took place in late April.
By the late-May cutoff date, 3,089 MDs and DOs had responded. After we set aside returns with apparent discrepancies and those from physicians who hadn't been providing office-based patient care throughout 2002, our working sample consisted of 1,994 physicians. These were coded by the Medical Economics research staff and then tabulated by computer by Suzanne Coopersmith of Crosstabs in Syosset, NY.
The survey sample was selected to be representative within each specialty as to type of practice, age, geographical region, and gender. The results were weighted to reflect these criteria.
Wayne Guglielmo. Physicians' Earnings: Our exclusive survey. Medical Economics Sep. 19, 2003;80:71.


