


Article
Investment Consult: Here's your best tool for checking out a stock
The Value Line Investment Survey provides a useful blend of data and analysis.
Investment Consult
Here's your best tool for checking out a stock
The Value Line Investment Survey provides a useful blend of data and analysis.
By Lewis J. Altfest, PhD, CFA, CFP
Before you buy a stockany stockit pays to do some research. A great place to start is with a publication I've relied on for years, both as a financial planner and as a partner at a Wall Street firm. It's called The Value Line Investment Survey, and it's published weekly by a team of more than 100 securities analysts, researchers, statisticians, and editors.
Value Line uses a unique, time-tested ranking system for the stocks it follows, and it provides price as well as total return projections through 2005. Many of the largest brokerage firms won't estimate that far out. Value Line also does the best job of adjusting sales and earnings data for factors such as nonrecurring gains and losses, so that you're presented with a truer picture of a company's finances and results from year to year.
Although a subscription to The Value Line Investment Survey is pricey$570 a year for either the print or CD-ROM versiona free copy is probably as close as your public library. What you'll actually find in the "survey" is a compilation of single-page reports on some 1,700 companies, most of which are large or mid-size. Smaller firms are included among the 1,800 additional stocks in the print version of Value Line's Expanded Edition, which costs $125 more. Yet despite what you might infer, the Expanded Edition's reports aren't as in-depth as those in the Standard Edition; the Expanded Edition doesn't include analysts' comments, for example. Regardless, either type of report presents a quick and unusually comprehensive summary of the facts about a company.
Some of these facts are more useful than others, however. With this in mind, here are the key Value Line data that I examine before recommending a stock to my clients. Please refer to the illustration below, which is indexed to the categories that follow.


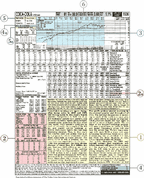
1 Background. On the bottom half of the image, you'll find a description of what the company does, plus contact informationphone number, street and Web addresses, etc. The analyst's opinions and interpretation of the data follow, with key points highlighted in bold type. This section usually includes current sales and earnings, as well as growth projections. It's best to read this section before diving into the raw numbersand to reread it when you've finished examining them. That's because the sales and earnings data sometimes don't tell the whole story about a stock; nor do they say anything about industry trends.
2 Past profitability. Most of this data appears in the lower left-hand corner of the image. Beginning under the heading "Annual Rates," you'll find the percentage changes in sales, earnings, dividends, cash flow, and book value over five and 10 years. Right below this, Value Line provides quarterly figures for sales, earnings, and dividends. So at a glance, you can see whether a company has a history of strong growth, which I define as an average increase of 10 percent or more in annual sales, or earnings that have jumped at least 15 percent a year.
Another good indicator of profitability is something that's often overlookedreturn on shareholder equity, which I've labeled "2a." As a benchmark, the typical large-cap stock has about a 21 percent return on equity, up significantly from the historical average. As you can see in the illustration, Coca-Cola's ROE of 43 percent indicates that the company is currently outperforming its large-cap brethren.
3 Market-related measures. It's also important to know how well a stock is doing relative to the overall market. The graphs at the top of the Value Line image depict this. The small vertical lines represent the stock's monthly price range. It's advisable, of course, to buy the stock at a price that's close to the 12-month low.
The dotted line shows the stock's movement relative to that of other Value Line companies. The solid line involves a complex formula that would take far too long to explain, and I don't find it as useful as the other graphs.
4 Risk- and volatility-related measures. In the bottom right-hand corner of the image, you'll see the headings "Stock's Price Stability," "Price Growth Persistence," and "Earnings Predictability." A score of 80 or better for each is good. Lower scores suggest cause for concern, or at least further investigation.
A more common measure is the stock's beta, marked "4a" on the image. Anything above 1.0 indicates greater-than-market volatility; if you're a conservative investor, look for stocks with betas below 1.0.
5 Projections. One way that Value Line rates stocks is with its timeliness rank. This measures a company's expected performance over six to 12 months vs projections for the other stocks Value Line follows. Stocks ranked 1 are among the top 100, and those that earn a 2 fall in the next 300. These represent stocks whose prices are expected to outperform the prices of the other 1,300. Those rated 3 probably won't do much, and those that receive a 4 or 5 will likely underwhelm.
To further help you, look at the projections for quarterly sales and earnings per share. You'll find them in the same section as the current and historical data for these figures, which I referred to when discussing past profitability. Any sales or earnings forecasts over 10 percent a year would qualify as above average, in my opinion. Because I expect earnings growth to slow somewhat in the next year or so, that's lower than the 15 percent or more that I like to see reported under recent earnings.
Look, too, at the total-return projections in the area I've marked "5a." If the average of the high and low isn't 10 percent or more, it's probably best to look for other stocks to buy. On this basis, I'd pass on Coca-Cola, at least for now.
Directly under this area, you'll see what corporate insidersthe folks presumably in the knoware doing with their shares. This is important because an unusually large number of actions can often suggest where the stock's price might be headed.
6 Valuations. These measuresrecent price, price-earnings ratio, relative P-E ratio, and dividend yieldappear at the top of the image. They combine the previous information and help you make a decision about the company.
The most useful of these measures is the relative P-E. A relative P-E of 1 or 2, for example, means the stock's valuation is one or two times higher than the typical Value Line company's. Anything higher than 1 had better be justified by strong long-term growth rates, or else the stock is in danger of underperforming.
When researching a stock, it's always smart to review annual reports and to collect information about the company from several impartial sources. Nevertheless, The Value Line Investment Survey gives you a good head start, and a valuable framework for monitoring your holdings. For more information, or to subscribe, call 800-535-2947 or visit www.valueline.com.
The author, a fee-only financial planner, is president of L.J. Altfest & Co.(www.altfest.com ), a financial and investment advisory firm in New York City. This column appears every other issue. If you have a comment, or a topic you'd like to see covered here, please submit it to Investment Consult, Medical Economics magazine, 5 Paragon Drive, Montvale, NJ 07645-1742. You may also send a fax to 201-722-2688 or e-mail to meinvestment@medec.com.
Lewis Altfest. Investment Consult: Here's your best tool for checking out a stock. Medical Economics 2001;2:23.