


Article
How does your productivity measure up?
Here's where to find out. Our latest survey results let you compare your patient load and work hours with those of colleagues in your specialty, region, and practice type.
Here's where to find out. Our latest survey results letyou compare your patient load and work hours with those of colleagues inyour specialty, region, and practice type.
Surprise! You're probably not working any longer than you were 10 yearsago.
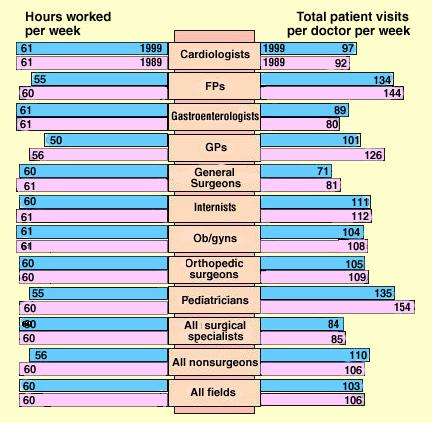
That's the biggest finding of our 1999 Continuing Survey, which pollsMDs and DOs in office-based private practice. Some doctors even saw theirmedian work week drop. For example, nonsurgical specialists reducedtheir workweeks from 60 hours in 1989 to 56 in 1999. FPs, GPs, internists,and pediatricians not only worked longer hours 10 years ago, but they alsosaw more patients than in 1999. Ob/gyns are working as long as they werea decade ago, but they're seeing fewer patients.
These findings suggest that some doctors are working smarter rather thanlonger. For instance, cardiologists see more patients per week than theydid in 1989, even though they work the same number of hours. General andorthopedic surgeons are spending about the same amount of time at work,but they performed many more major operations in 1998 than they did a decadebefore (103 more for general surgeons and 43 more for orthopedic surgeons).
Among the nine specialties we've analyzed, cardiologists, gastroenterologists,and ob/gyns work the longest, if only slightlya median of 61 hoursper week. But pediatricians see the most patients per week135followedclosely by FPs, at 134.
A full 11 percent of ob/gyns work 90 hours or more per week, up from9 percent in 1996, when we last looked at productivity. At the same time,more ob/gyns are working less than 40 hours: 9 percent in 1999, up from7 percent in 1996.
Internists did 50 percent more comprehensive diagnostic histories andphysical exams in 1998 than FPs, and three times as many as GPs.
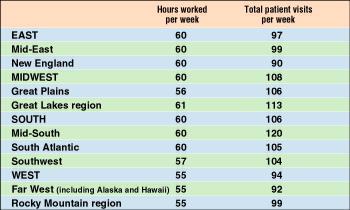
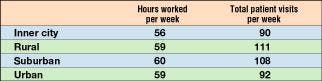
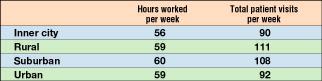
Where a doctor toils influences his work habits. Those practicing inthe Midwest report the most patient visits per week, followed closely bydoctors in the South. Doctors in the Great Lakes regionIllinois, Indiana,Michigan, Ohio, and Wisconsinwork the longest hours. Although suburbanphysicians work one more hour per week than those in any other type of community,rural doctors have the most patient encounters.
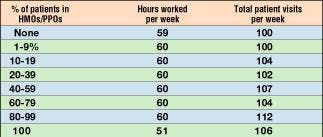
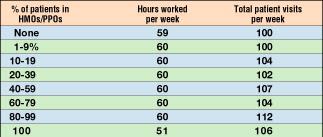
As you suspected, managed care makes more work. Doctors with 80 to 99percent of their patients in HMOs and PPOs report 12 percent more officeand hospital visits per week than those with fewer than 10 percent of theirpatients in managed care.
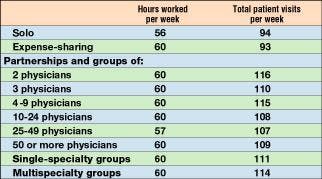
Group size and specialty mix make little difference in the length ofthe workweek, but these factors do affect patient-visit rates. Both soloistsand physicians in groups of 25 to 49 put in practically the same numberof hours a week56 and 57, respectively. But soloists see a median94 patients, while the group physicians see 107. Weekly patient-visit ratesare highest in groups of five to nine, where physicians log a median 116office and hospital visits. Doctors in partnerships of four to nine aren'tfar behind, at 115.
Does gender matter? Somewhat. Women doctors in general work fewer hours,and they also see fewer patients.
Use the following charts and tables to compare your productivity figuresagainst those of your colleagues. For information about how the survey wasdone, see the Sept. 20, 1999, issue.
How hours worked and patient visits vary by specialty . . .

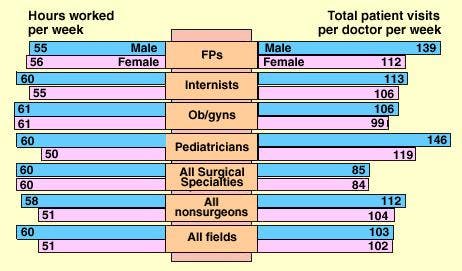
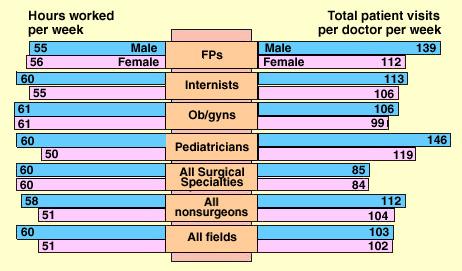
¹Hours worked refers to time spent in all professional activities. ² Total patient visits are the number of times the physician saw patients in the office, hospital, and at other locations. Figures for total patient visits exclude pathologists. Data in this and the charts and tables that follow apply to individual office-based MDs and DOs during a typical week in the spring of 1999, unless otherwise stated. All figures are medians. Source: the
Medical Economics
Continuing Survey.
By region . . .


By practice location . . .

By proportion of managed care patients . . .

And by practice size and type


Ranges of hours worked in nine specialties

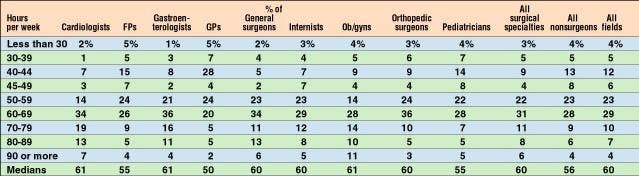
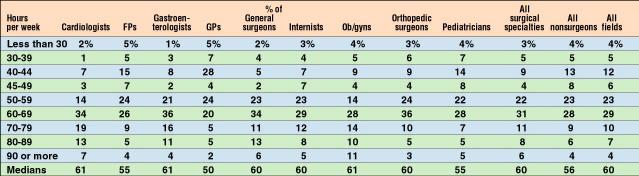
Because of rounding, percentages may not total 100.
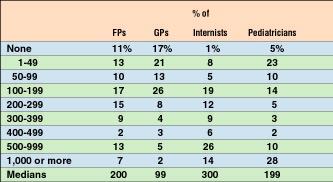
Ranges of patient-visit rates by specialty

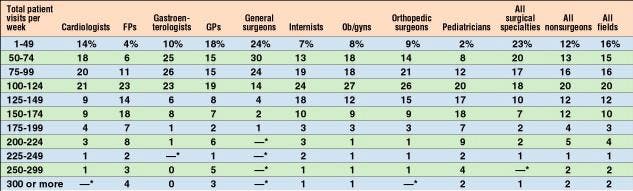
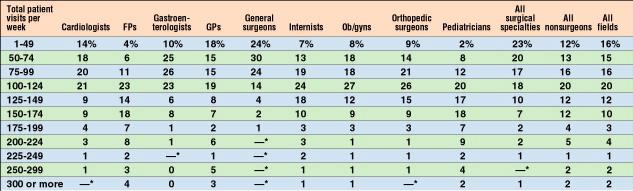
*Less than 1 percent. Because of rounding, percentages may not total 100.
Where doctors see most patients

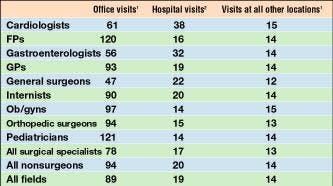
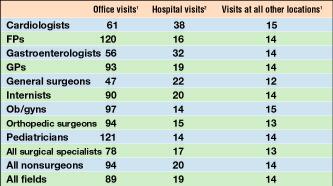
¹Excludes anesthesiologists, emergency physicians, pathologists, and radiologists. ²Excludes pathologists and radiologists. Figures are median visits per week.
Who did the most histories and physicals

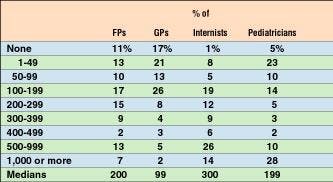
Figures are for 1998. Data exclude respondents who reported not doing the stated services. Because of rounding, percentages may not total 100.
Are you working harder than you were 10 years ago?


Figures are medians.
Women vs men in selected specialties
Figures are medians.
Susan Harrington Preston. How does your productivity measure up?.
Medical Economics
1999;22:54.