


Article
Capitation on the rise
Author(s):
It's roping in more doctors and making up more of their income, our latest survey shows.
Capitation on the rise
It's roping in more doctors and making up more of theirincome, our latest survey shows.
By Ken Terry, Managed Care Editor


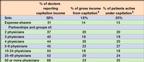
Physician participation in capitated plans, which leveled off a coupleof years ago, is climbing again. According to the latest Medical EconomicsContinuing Survey, which includes MDs and DOs in office-based private practice,44 percent of physicians in all fields received capitation payments in 1998,compared with 40 percent in 1996, the last time we looked at this issue.And the share of gross income those doctors derived from capitation advancedfrom 15 to 20 percent.
All primary care physicians except FPs saw significant increases in capitationincome and participation. The portion of general internists who held capitationcontracts jumped from 62 to 69 percent, and the capitation slice of theirgross income widened from 10 to 18 percent. Participation by pediatriciansin capitated plans rose from 69 to 78 percent, and capitation contributed28 percent of their revenue, compared with 20 percent in 1996.
In contrast, only 61 percent of FPs reported some capitation income,down from 63 percent in our earlier survey. And they derived less of theirrevenue from capitation than they did two years earlier22 vs 23 percent.
Some subspecialties also saw dramatic increases in prepayment participationand income. For example, 45 percent of surveyed cardiologists had some prepaymentbusiness last year, compared with 37 percent in 1996. And among those whoheld such contracts, 14 percent of their gross income was prepaid, up from10 percent two years earlier.
Surgical specialties were split. Cardiothoracic surgeons and ophthalmologistssaw big increases in capitation, whereas neurosurgeons and orthopedic surgeonswere about even with the last survey. Ob/gyns' participation dropped from26 to 21 percent, but those who did participate earned about the same portionof their income from capitation15 percentas they did in 1996.
The overall surge in prepaid income is occurring all over the country.Physician participation, percentage of gross income from capitation, andthe percentage of active patients under capitation have increased in theEast, South, and Midwest. Even in the West, where capitation has historicallybeen strongest, physician involvement and the prepaid portion of practicerevenues are up.
The phenomenon puzzles some observers, who note that many HMOs and providerorganizations are backing away from at least one form of capitationglobalcapitation. But some plans may have capitated individual doctors who formerlybelonged to failed IPAs and PPMs that took global risk. If those organizationshad been paying the physicians fee for service, the switch would add tothe number of doctors now receiving capitation.
With so many plans showing losses over the past couple of years, transferringrisk to individual practices is an attractive option, says internist PeterKongstvedt, a partner in the consulting and accounting firm of Ernst &Young. The plans also save money by not having to process claims, he adds.
Data gathered by InterStudy, a Minneapolis-based research firm, showthat from July 1997 to July 1998, the portion of HMOs paying capitationto at least some of their primary care doctors jumped from 57 to 79 percent.And while only 33 percent of HMOs capitated any specialists in 1997, 56percent did so last year.
Provider organizations that take professional or global risk are alsoincreasingly capitating specialists. In California, says pediatrician HenryGolembesky, a San Diego-based consultant with Cejka & Co., two factorsexplain this trend. First, he says, group practices and IPAs have builtlarge enough bases of capitated patients to make specialty capitation actuariallyfeasible. And second, these groups' financial position has become so weakthat they can no longer afford to pay specialists fee for service.
Elsewhere in the country, he notes, IPAs, PHOs, and group practices aretrying to capitate physicians when they obtain risk contracts in order toavoid the financial problems that plague their West Coast counterparts.
Golembesky also cites the rise of specialty carveout networks as a reasonfor the spread of capitation among specialists. Whether they contract withHMOs or large provider organizations, these carveouts offer risk-takingentities a way to fix their costs for cardiovascular care, cancer, mentalhealth, and other conditions.
HMOs have also targeted many secondary markets where there was littleor no capitation two years ago, notes Gary Matthews, a practice managementconsultant with the HealthCare Advisory Group in Atlanta. Richmond, VA,for example, is about 35 percent capitated now; in 1996, capitation waspractically unknown there. Smaller markets like Macon, GA, are also dabblingin prepaid care for the first time, he adds.
While the spread of managed care into the nation's nooks and cranniesmay have contributed to the resurgence of capitation, it hasn't increasedoverall managed care participation by physicians. The proportion of respondentswho participated in managed care plans in our recent survey was virtuallythe same as in our previous one, 76 percent in HMOs and 81 percent in PPOs.
Some surgical specialties, however, did increase their managed care involvement.For example, in the past two years general surgeons' participation in HMOsand PPOs jumped from 76 to 80 percent and from 82 to 84 percent, respectively.
Even in specialties that didn't increase participation, the percentageof gross income from managed care was up. For instance, HMOs gave participatingcardiologists 19 percent of their revenues, up from 12 percent in 1996.Cardiologists' PPO earnings also shot up, from 10 to 19 percent of grossrevenues.
For physicians in all fields who held managed care contracts, HMOs contributed25 percent of revenue, up from 20 percent in 1996, and PPOs supplied 24percent, also compared with 20 percent. Specialists deriving the highestportion of their gross income from HMOs and PPOs were anesthesiologists,FPs, ob/gyns, and pediatricians.
The participation of one- and two-doctor practices in managed care droppednoticeably over the two-year period. Only 77 percent of soloists contractedwith HMOs or PPOs, down from 82 percent in our previous survey. For partnerships,HMO/PPO participation dropped to 89 percent from 93 percent. The likeliestexplanation, says Peter Kongstvedt of Ernst & Young, is that physiciansin small practices tend to be older and more disgruntled with managed careplans and are thus less likely to contract with them.
Gary Matthews, in contrast, believes that small practices may not beable to obtain managed care contracts, especially in large urban areas.In Atlanta, he says, "I know two-, three-, and even four-doctor practicesthat can't get a health plan to send them an application. If the small practicesdon't belong to networks, they're just not invited to the ballgame. Andas the plans consolidate, there aren't that many options out there. Today,an Aetna contract can be 40 percent of the market."
For practices with managed care contracts, the portion of active patientsin HMOs increased from 25 percent to 30 percent during the two-year period,and the portion of active patients in PPOs rose from 20 to 24 percent. Sincethe percentage of doctors who contracted with managed care plans was flat,it's clear that participating doctors siphoned off patients from nonparticipants.
During the same period, the percentage of office visits by HMO patientsshot up from 22 percent to 32 percent. Similarly, the percentage of PPOpatient visits soared from 18 percent to 27 percent. These visit numbersare 2 to 3 percentage points higher than the percentages of activeHMO and PPO patients. In contrast, the visit figures from our last surveywere 2 to 3 points lower than the percentages of active managed carepatients.
The growing presence of capitation can't explain this change. Acrossall fields, the percentages of active patients under capitation and of visitsfrom those patients were identical in 1998.
One possible explanation for the shift: As a higher portion of the insuredhas gone into managed care, more of them have had illnesses requiring officevisits.
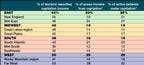
With fewer small practices involved in health plans, the percentage ofdoctors reporting any managed care participation dropped in every area ofthe country between our last survey and this one. But in every region exceptthe West, the percentage of gross income from HMOs and PPOs rose for physicianswho did participate in these plans.
In terms of physician participation in managed care, the East (at 85percent) beat the West (82 percent). But the Rocky Mountain region and theFar West still surpassed every other subregion except for New England inthe percentage of gross income from managed care and the share of activepatients in health plans.
In the most recent survey, 80 percent of inner city and rural physiciansreported HMO/PPO participation, which isn't much less than the portion ofurban (83 percent) and suburban (87 percent) doctors who contract with healthplans. But the percentages of gross income and of active patients garneredfrom these plans were still far lower in rural areas than in more populatedregions.
Only 35 percent of country doctors had capitation contracts, comparedwith 50 percent of inner city practitioners, 41 percent of urban physicians,and 47 percent of suburban doctors. But for those doctors who received capitation,the percentage of gross income from that source and of active patients inprepaid plans was roughly similar in the country, city, and suburbs.
Observers speculate that the rising tide of Medicaid managed care accountsfor much of the capitation and HMO activity in rural and inner city areas.One piece of data that supports this theory is the increased managed careinvolvement of GPs, who find it easiest to get on HMO and PPO panels ineconomically downtrodden areas that other doctors avoid. GPs' participationin capitated plans leaped from 48 percent to 60 percent during the two-yearperiod.
While Medicare HMO growth has flattened over the past year or two, PeterKongstvedt notes that it's still on the upswing in many urban areas. Thismight have contributed to doctors' participation in capitated plans, henotes. And it could have raised their gross income from capitation evenmore, since Medicare plans pay three times as much per member as commercialHMOs do.
To see where you fit into the evolving managed care picture, see theaccompanying tables. Our survey methodology is detailed in the Sept. 20,1999, issue (available at www.memag.com).
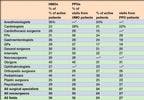
How participation rates vary by specialty

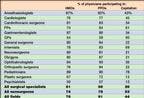
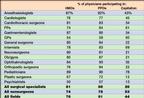
Because participation may overlap, percentages total more than 100. Hereand in the tables that follow, HMO and PPO participation figures are fora typical week in early spring of 1999. The source throughout these chartsand tables is the Medical Economics Continuing Survey. Figures aremedians.
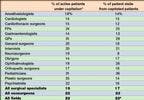
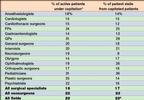
Who earns the most from managed care

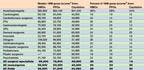
1Gross is the individual physician's share of 1998 practicereceipts before professional expenses and income taxes. Figures excludephysicians with no HMO, PPO, or capitation contracts.2Insufficient sample. Neurosurgeons also yielded an insufficientsample.
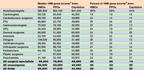
How managed care affects patient visits


*Insufficient sample. Figures are medians and exclude physicians withno HMO or PPO contracts. Here and in the tables that follow, patient visitsare medians for a typical week in spring of 1999.
How capitation affects patient visits
*Excludes physicians with no capitation contracts. Figures are medians.
How practice size correlates with capitation ...

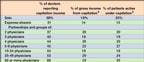
and managed care participation

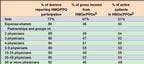
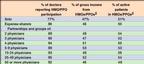
1Excludes physicians with no capitation contracts. 2Excludes physicians with no HMO or PPO affiliations. Figures are medians.
Capitation is growing across the country ...

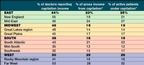
and spreading to all kinds of areas


*Excludes those physicians with no capitation contracts.
Managed care is still strongest out West

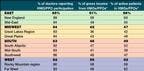

and in heavily populated areas


*Excludes those physicians with no HMO or PPO affiliations.
Carol Pincus, ed. Ken Terry. Capitation on the rise.
Medical Economics
1999;23:188.